
Introduction to the concept of Cross Entropy and its application
Topics covered:
Definition of Entropy
Explaination of Cross Entropy (KL Divergence)
Understanding how cross Entropy Loss function works with Softmax
-
1
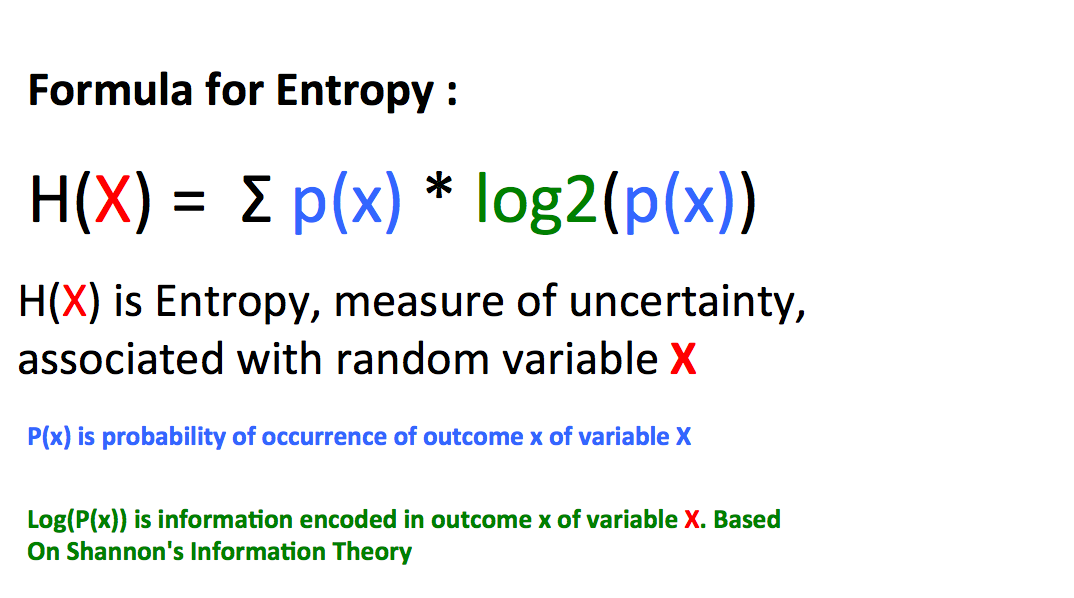
What is Entropy?
It is a measure of uncertainity.A Fair coin, for instance has highest Entropy, because heads and tails (outcomes) are equally likely.Entropy allows us to search for patterns in Big data.
If we spin a wheel 10 times, what is the Entropy?
Fig1:In the above graphic, probability is count of outcome (red or green or yellow) divided by total number of events. Log of this probability is the amount of information encoded as per Shannon's Information theory. Entropy for the above example is 1.5, which is measure of uncertainity. If Entropy is zero, there is no unertainity, that is it is easy to make predictions
Another example to calculate Entropy of arrival times of an Airlines
Download Excel sheet with Entropy calculations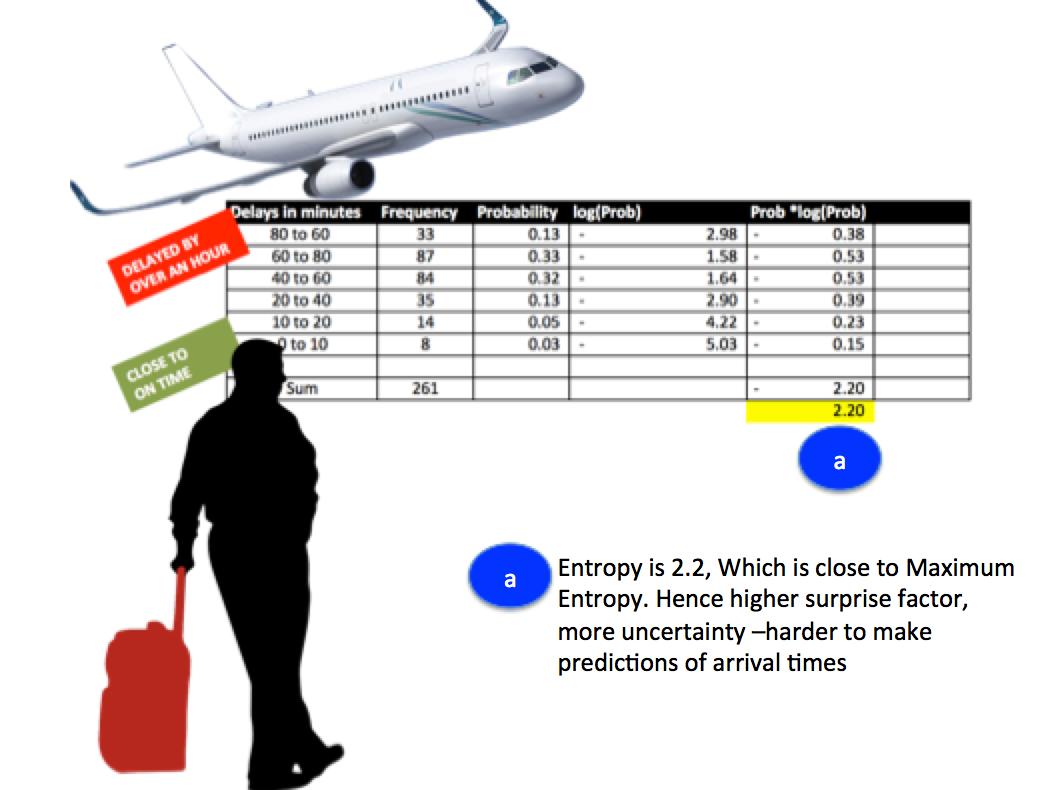
Fig 2: In the visual, Arrival delays and their frequencies are listed. The goal is to asses the unertainity in data, which would enable prediction of delay in next arriving flight.Here Entropy is 2.2.The question would be how close is this measure of information to Max entropy(based on Shannon's Information theory) which is log to the base 2 of total number of outcomes.
When is the Entropy Maximum in the sample Airlines delay data ?
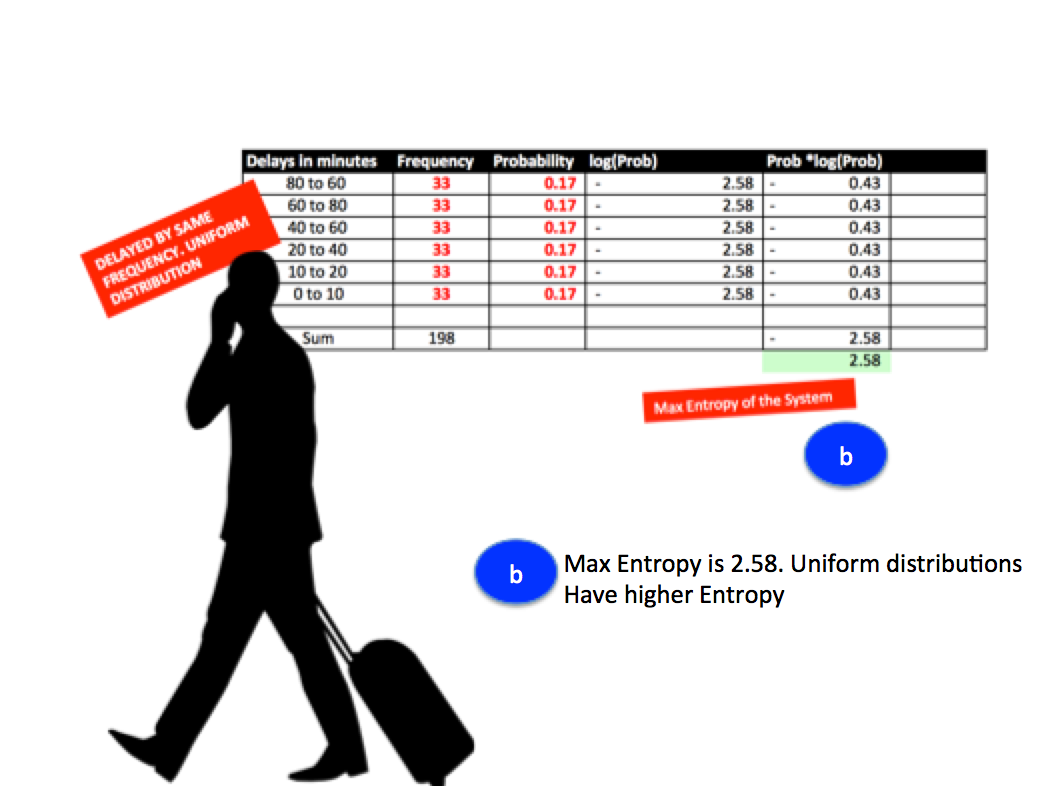
Fig 3: When the frequencies are equally distributed, Entropy is highest. Calculated Entropy (2.2 from Fig2 ) is close to Maximum Entropy for the system (2.58), hence there is considerable uncertainty in the ability of this pattern to forecast delays. Higher Entropy suggests more patterns and higher uncertainity.
Reminder: If Entropy is high, surprise factor is high.Fair coin for instance has higher Entropy.Heads and Tails are equally probable
-
2
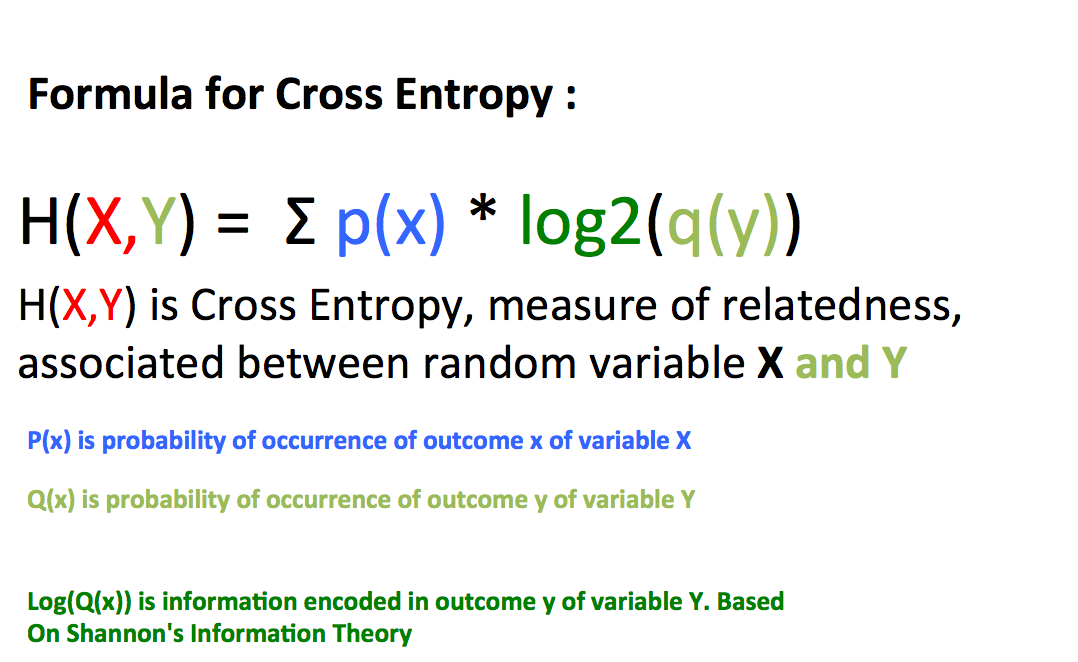
What is Cross Entropy ?
In Machine Learning, Cross Entropy is used to compare approximate models.
Lets assume we need to compare two arrival delay distributions taken during summer and winter seasons.
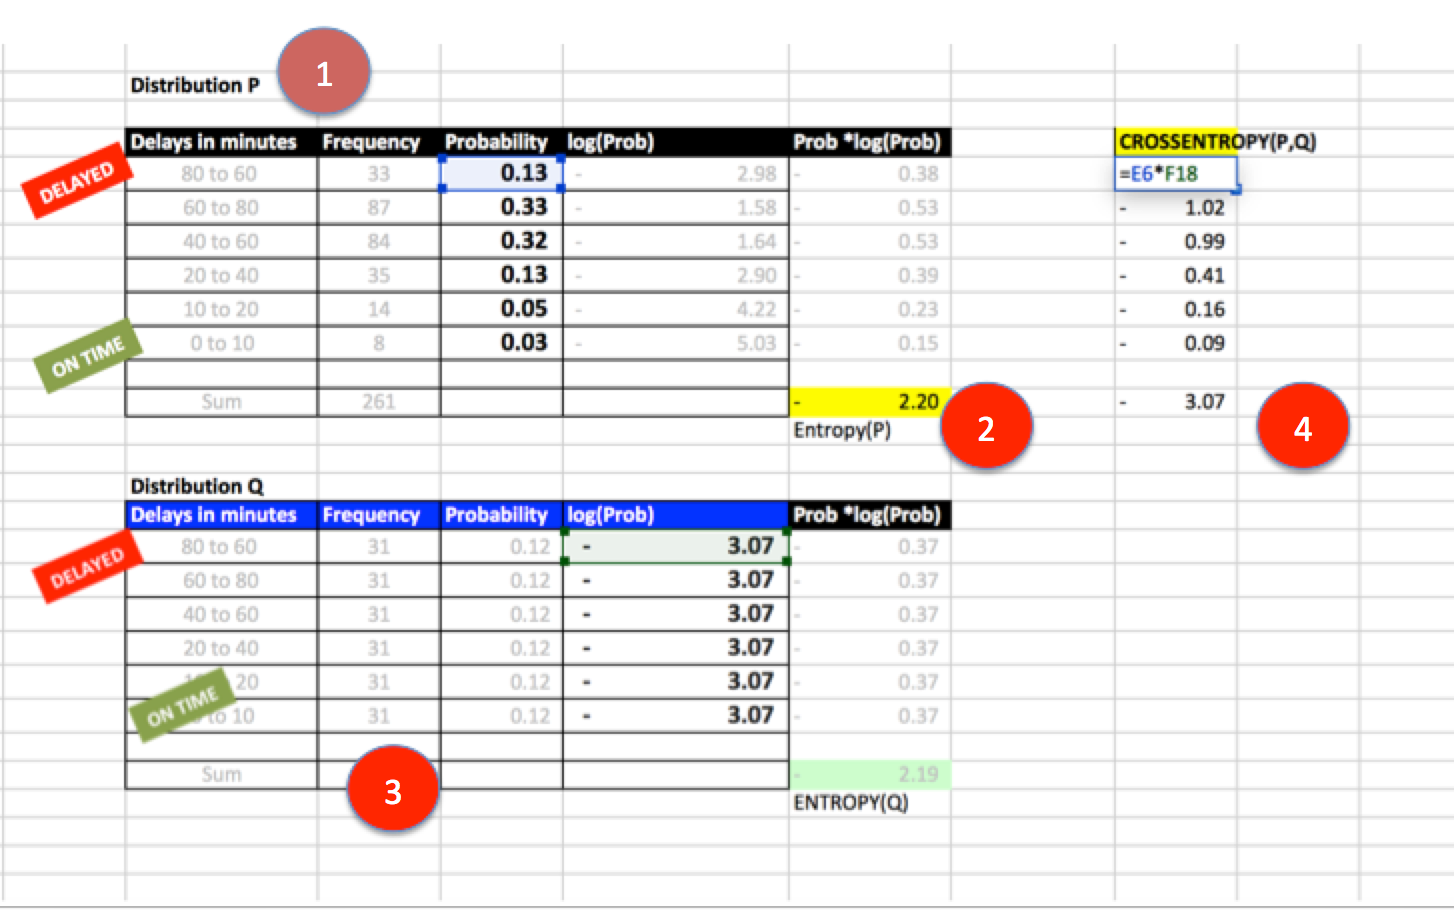
1: Let this be a base reference distribution. Call it P.
2: Note that Entropy for P is 2.2.
3: Change these frequencies to form distribution Q
4: Measure cross Entropy (P,Q)
In the above example, cross Entropy(P,Q) is bigger than Entropy(P), hence P and Q are not good approimations.
Please note that KL Divergence is similar to Cross Entropy.Used to find distance between distributions
-
3
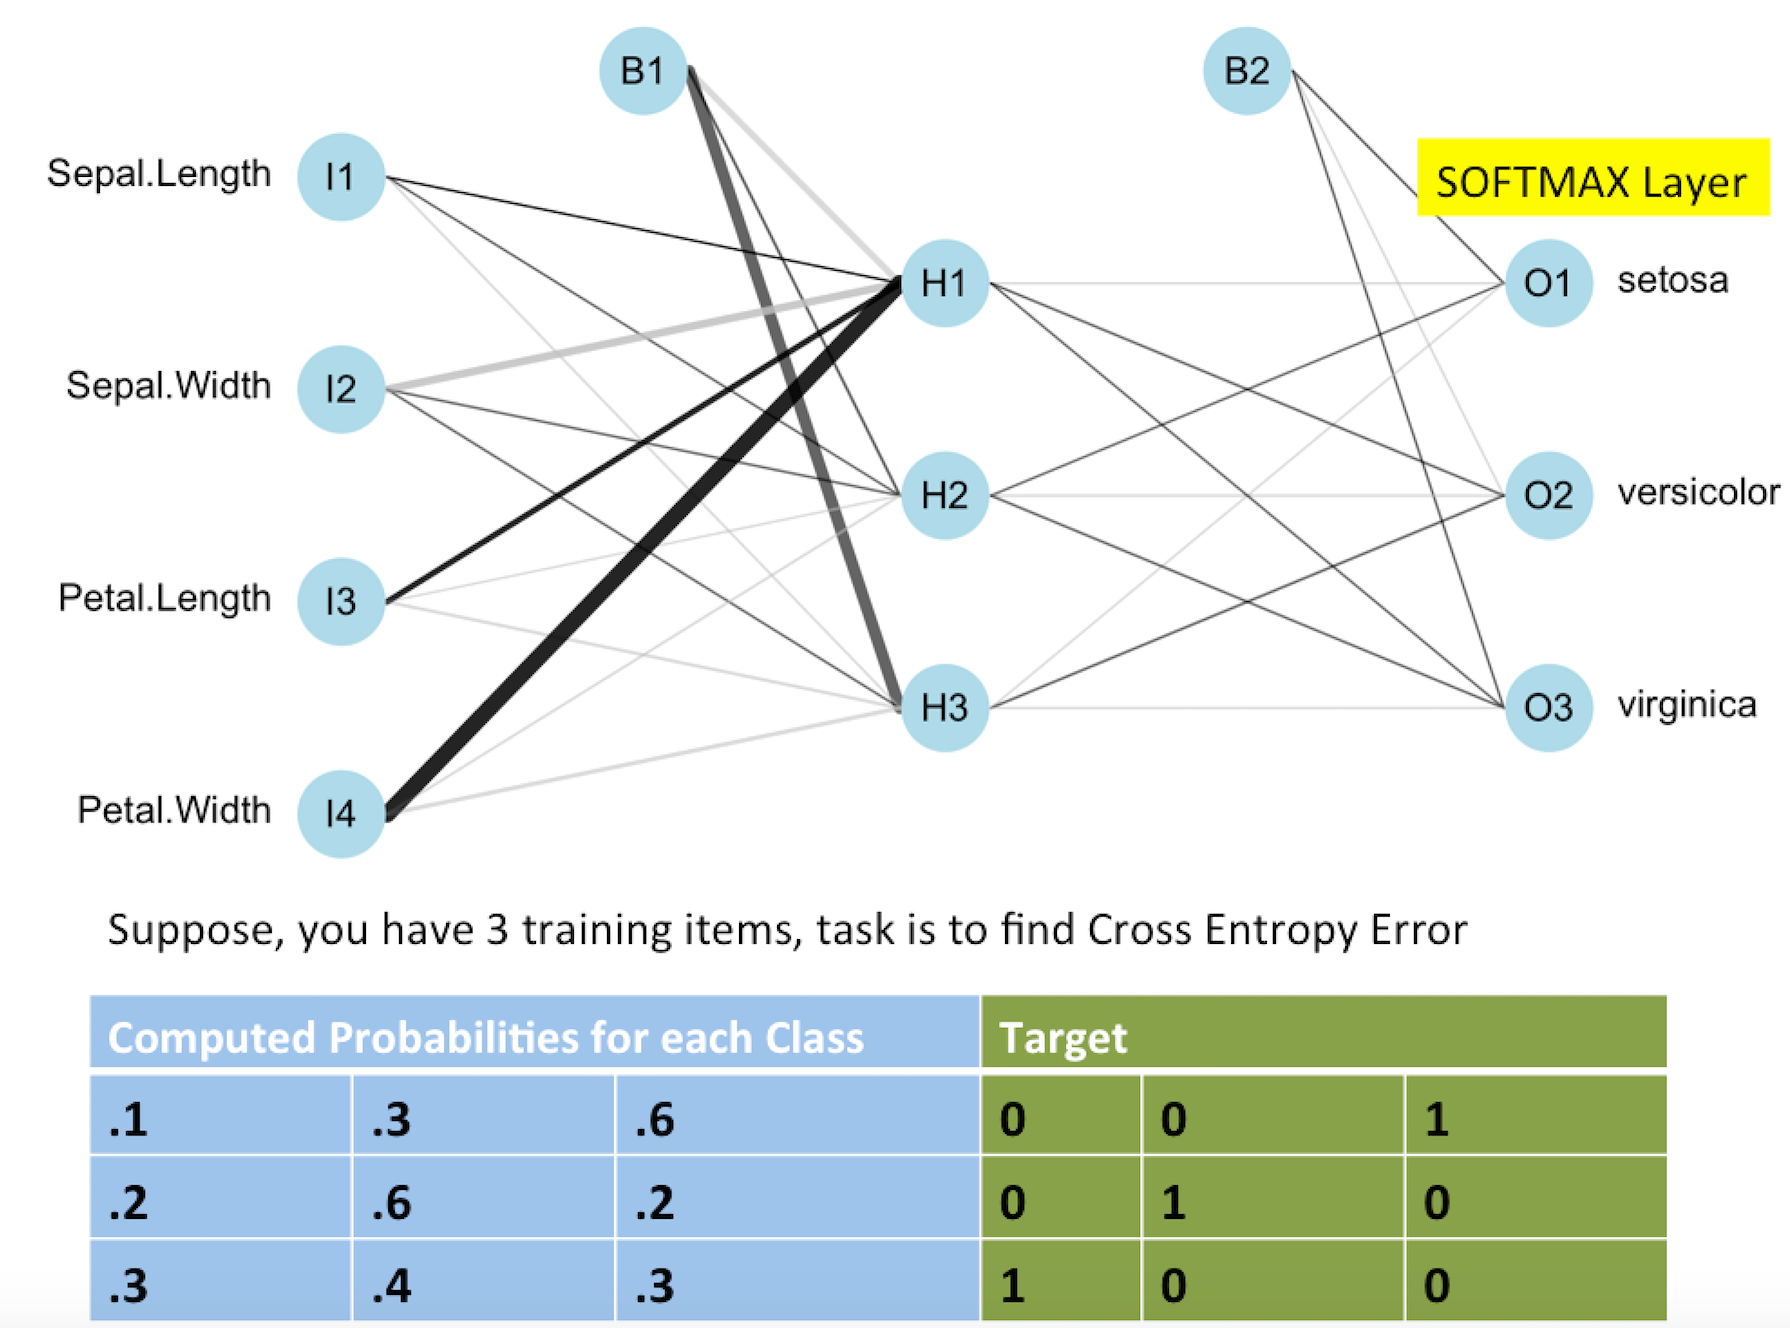
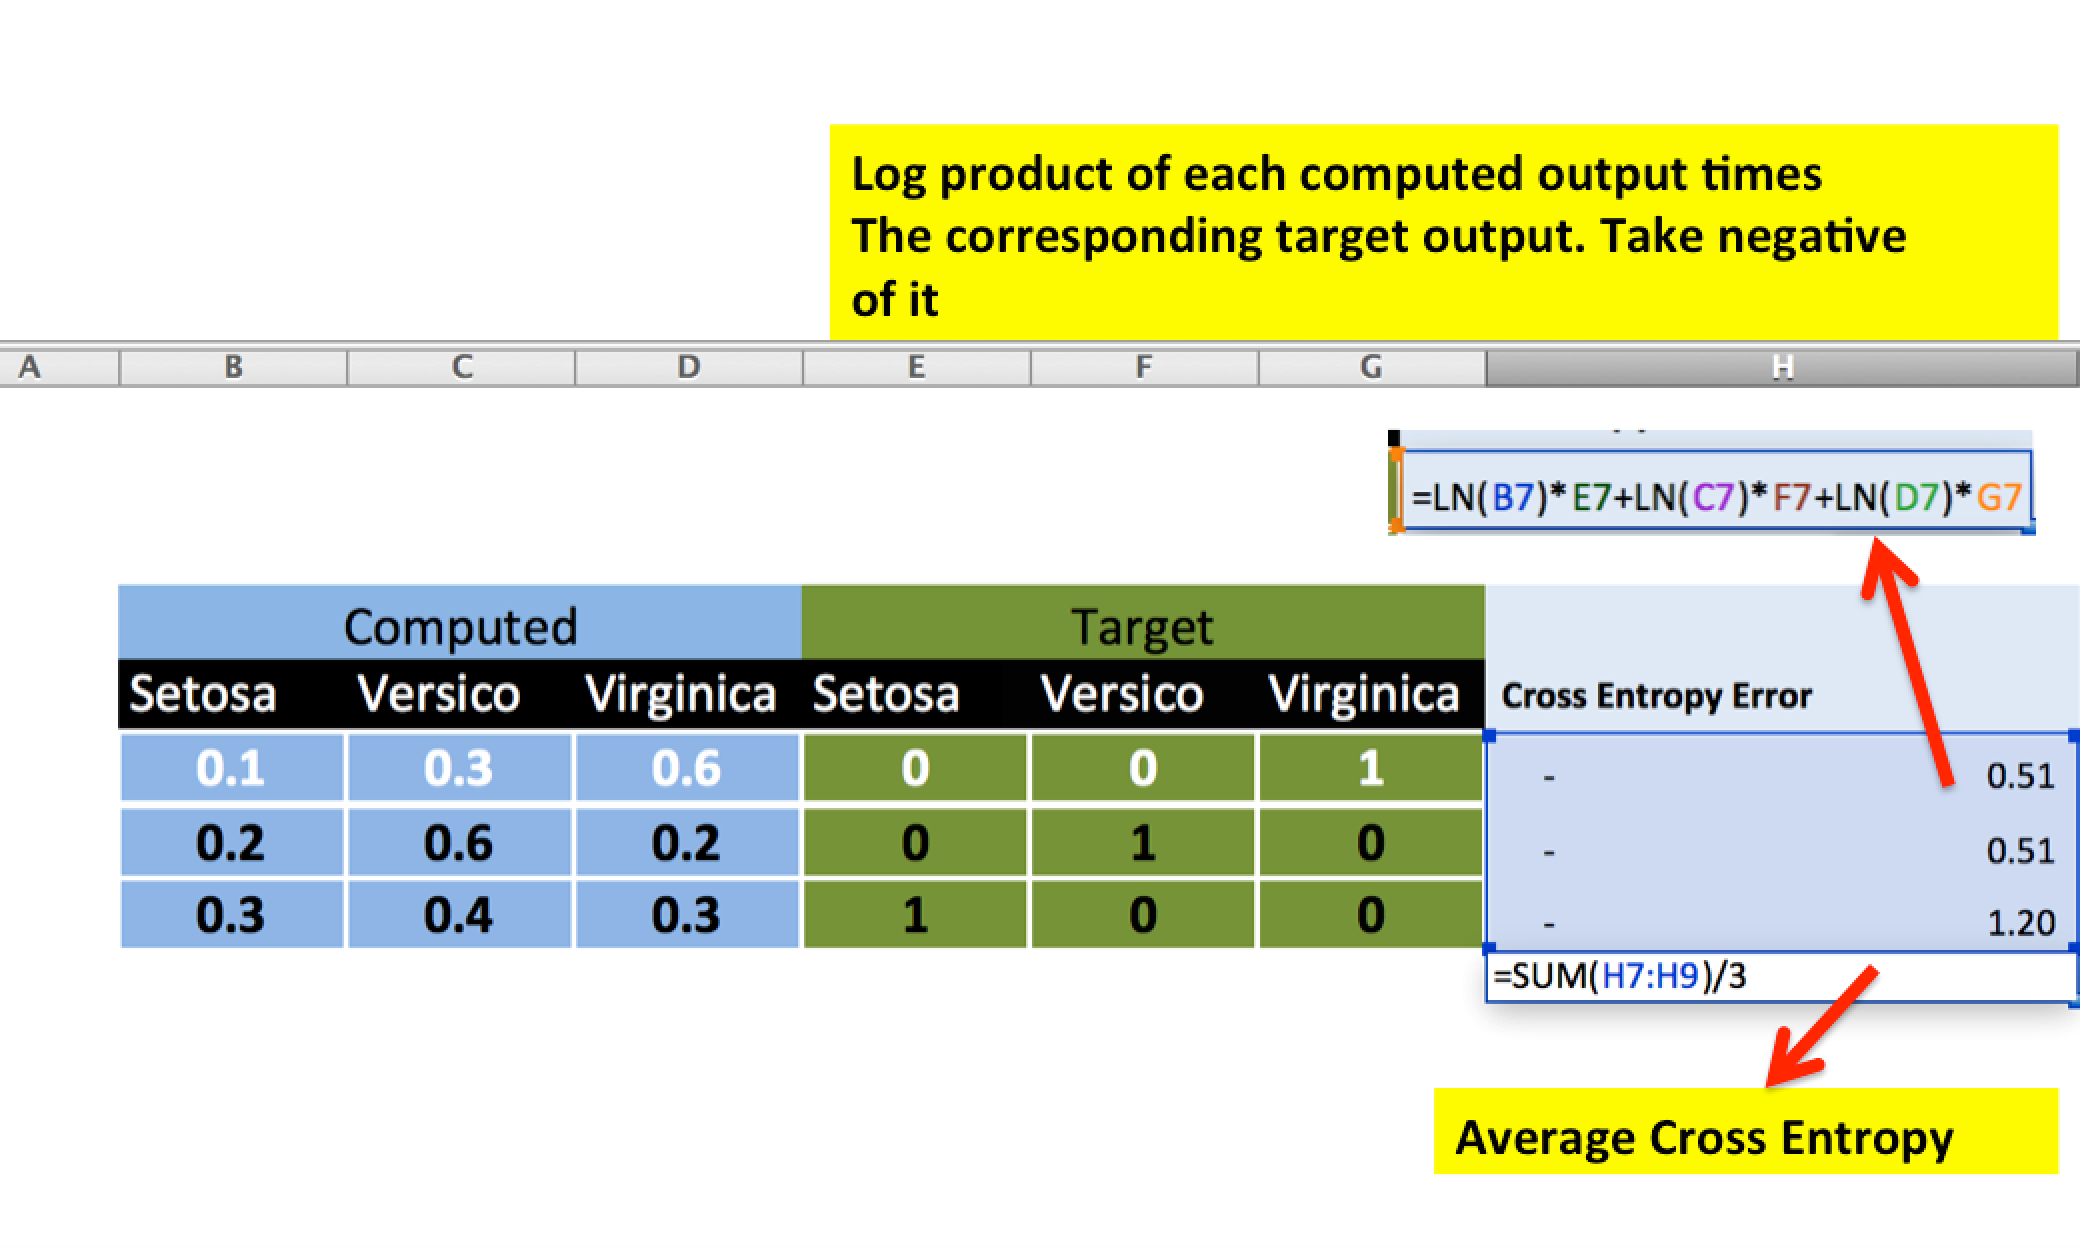
Cross Entropy Loss function with Softmax
1: Softmax function is used for classification because output of Softmax node is in terms of probabilties for each class.
2: For The derivative of Softmax function is simple (1-y) times y. Where y is output
3: Computation of gradients at each node is much easier with Softmax and Cross Entropy Error Function. Gradients at each is just the difference between target and computed output values
These gradients are a measure of how far off, and in what direction (positive or negative) the current computed outputs are relative to the target outputs.
Watch Professor Hinton's explaination on benefits of using Softmax and Cross Entropy Loss function together for classification tasks
Finally, code to plot neural net
      library(neuralnet)
      library(NeuralNetTools)
      nnet_iristrain_1<-read.csv('https://dl.dropboxusercontent.com/u/75324587/data/neuralNet.csv')
      nn <- neuralnet(setosa+versicolor+virginica ~
                Sepal.Length+Sepal.Width
                            +Petal.Length
                            +Petal.Width,
                data=nnet_iristrain,
                hidden=c(3))

       plotnet(nn, alpha=0.6)
Cross Entropy Example
Derivative Cross Entropy
References
RExample clipArt Cross Entropy Example
BTW, you might also like these previous posts
Intuition behind concept of gradient vector: https://t.co/vejnoSADmr #DataScience #MachineLearning by @pavanmirla pic.twitter.com/DKcX1p9X4m
— Kirk Borne (@KirkDBorne) July 17, 2016
Cool, colorful, creative → Perceptron Learning Algorithm in plain words https://t.co/LPmMTPsRHb #DataScience #MachineLearning by @pavanmirla
— Kirk Borne (@KirkDBorne) August 10, 2016
Maximum Likelihood Estimate (MLE) and Logistic Regression simplified: https://t.co/CUdOhpP4ko #DataScience #MachineLearning by @pavanmirla
— Kirk Borne (@KirkDBorne) July 25, 2016