
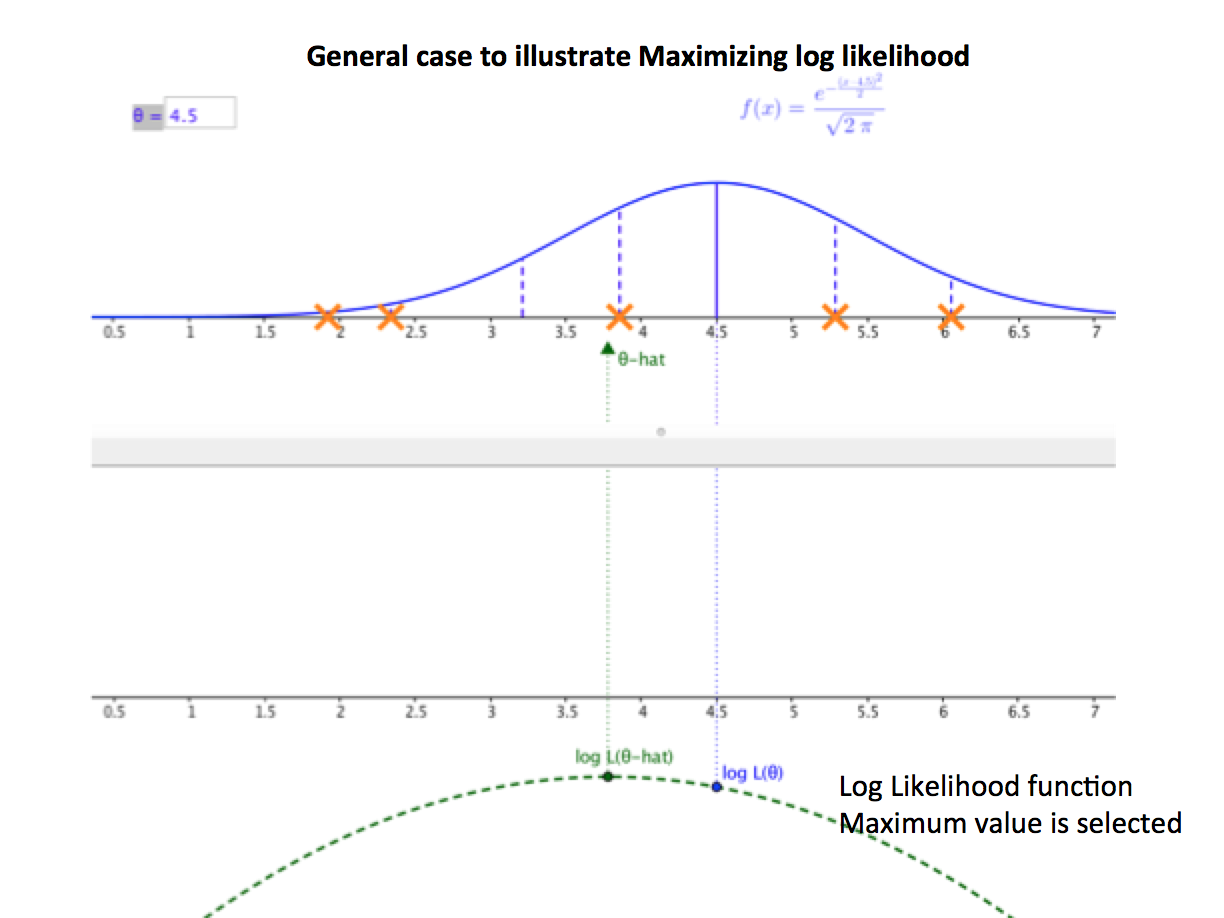
MLE focuses on the fact that different populations generate different samples. The figure below ilustrates a general case in which the sample is known to be drawn from a normal population with given variance but unknown mean.
Assume that observations came from either distribution A or distribution B.If the true population were A, the probability that we would have obtained the sample shown would be quite large.
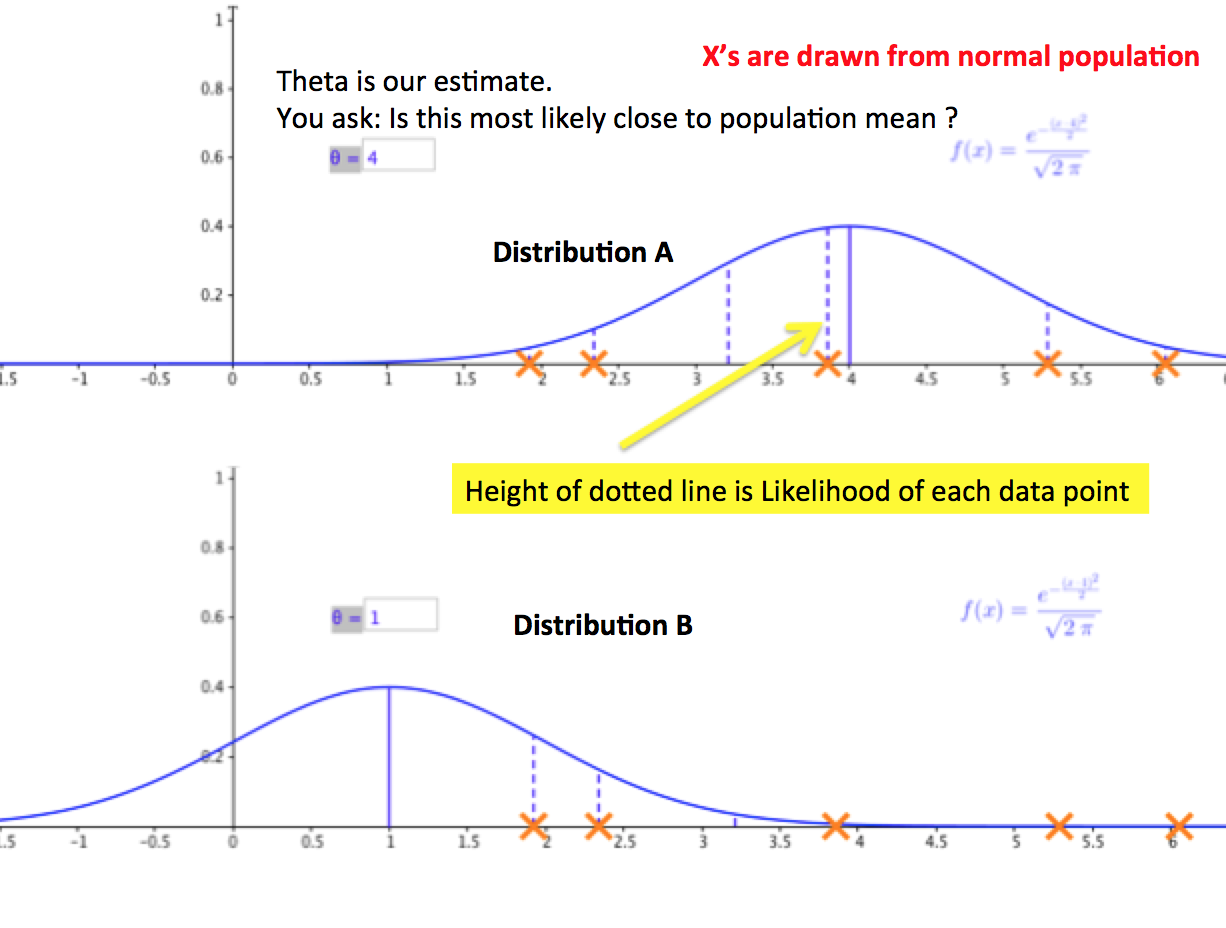
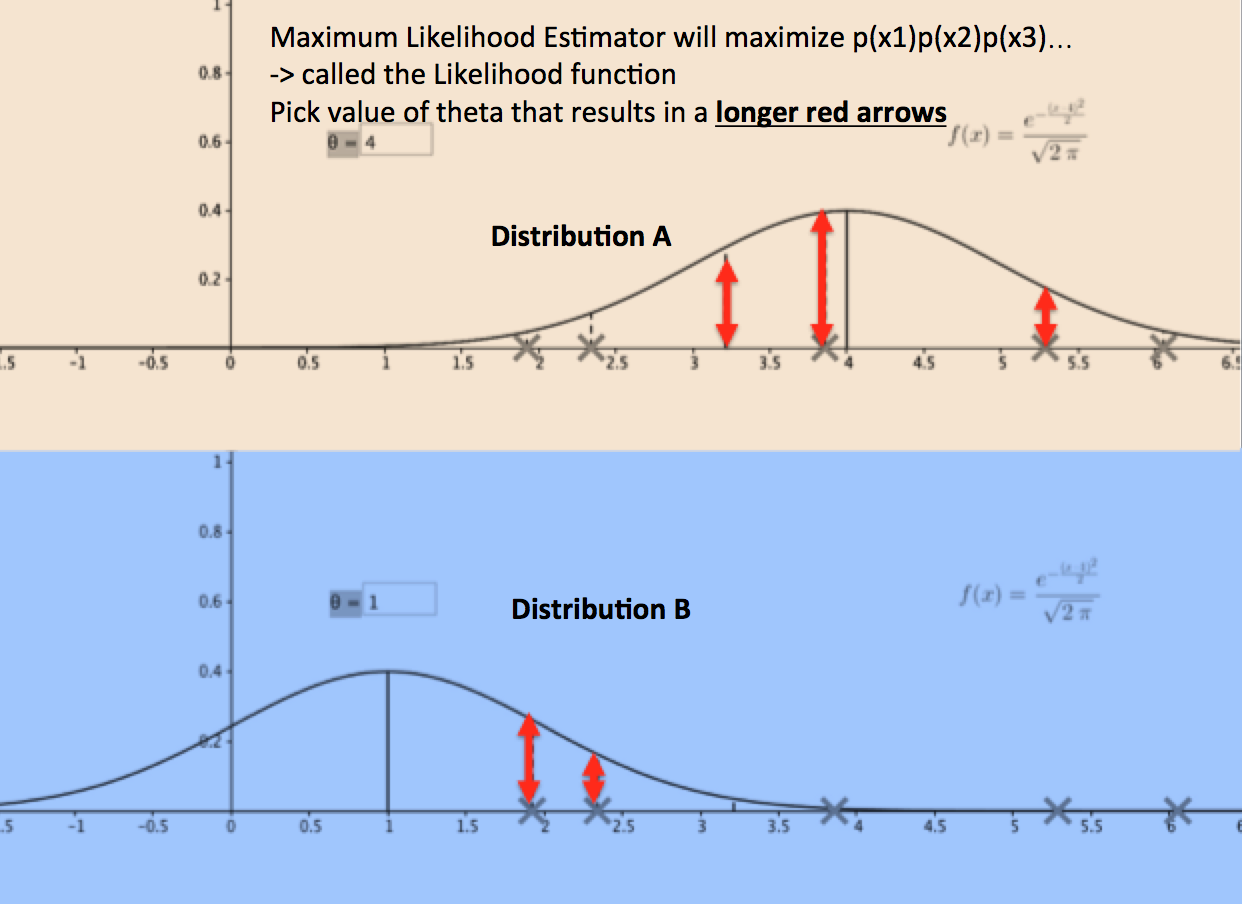

Fig1: clip from movie zootopia
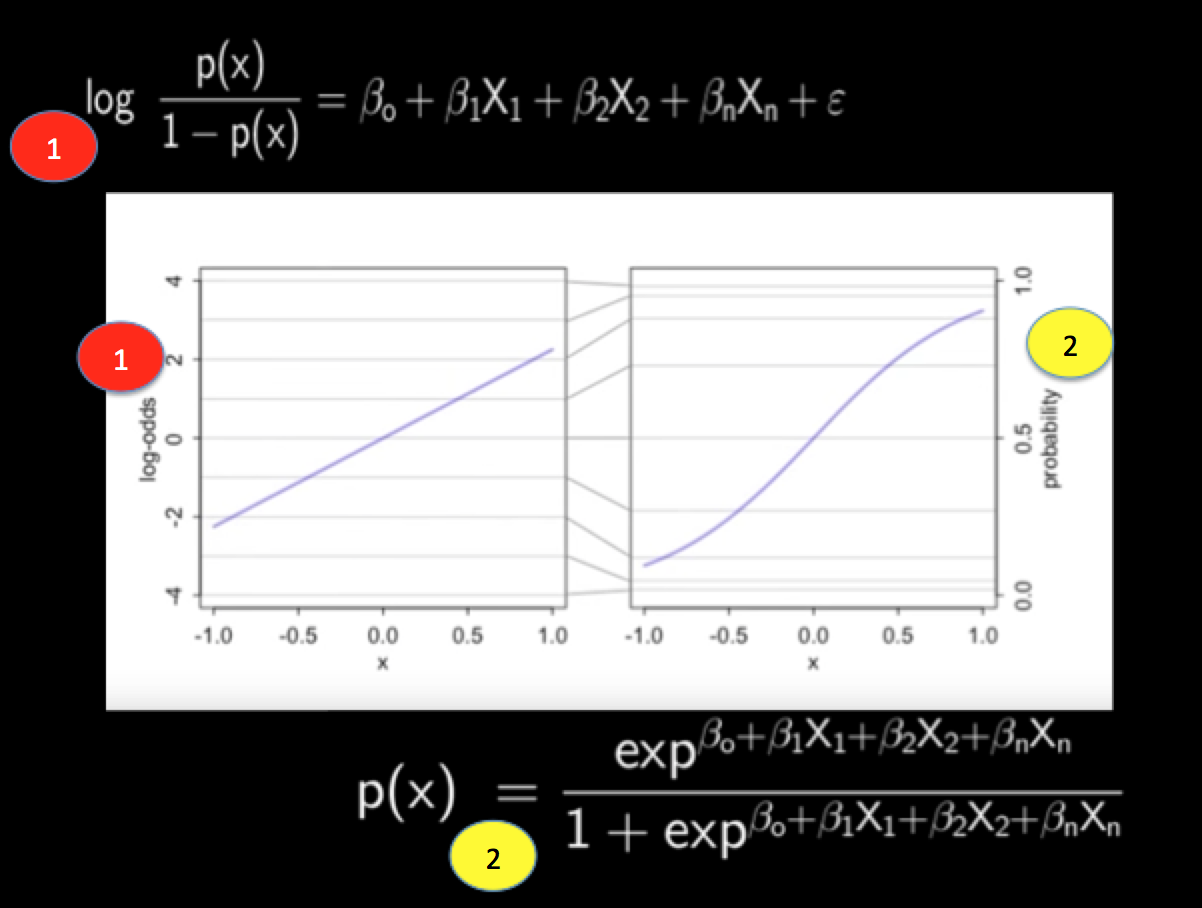
Least squares regression can cause impossible estimates such as probabilities that are less than zero and greater than 1.So, when the predicted value is measured as a probability, use Logistic Regression
Download spreadsheet here Conrad Carlberg’s book- Decision Analytics: Excel
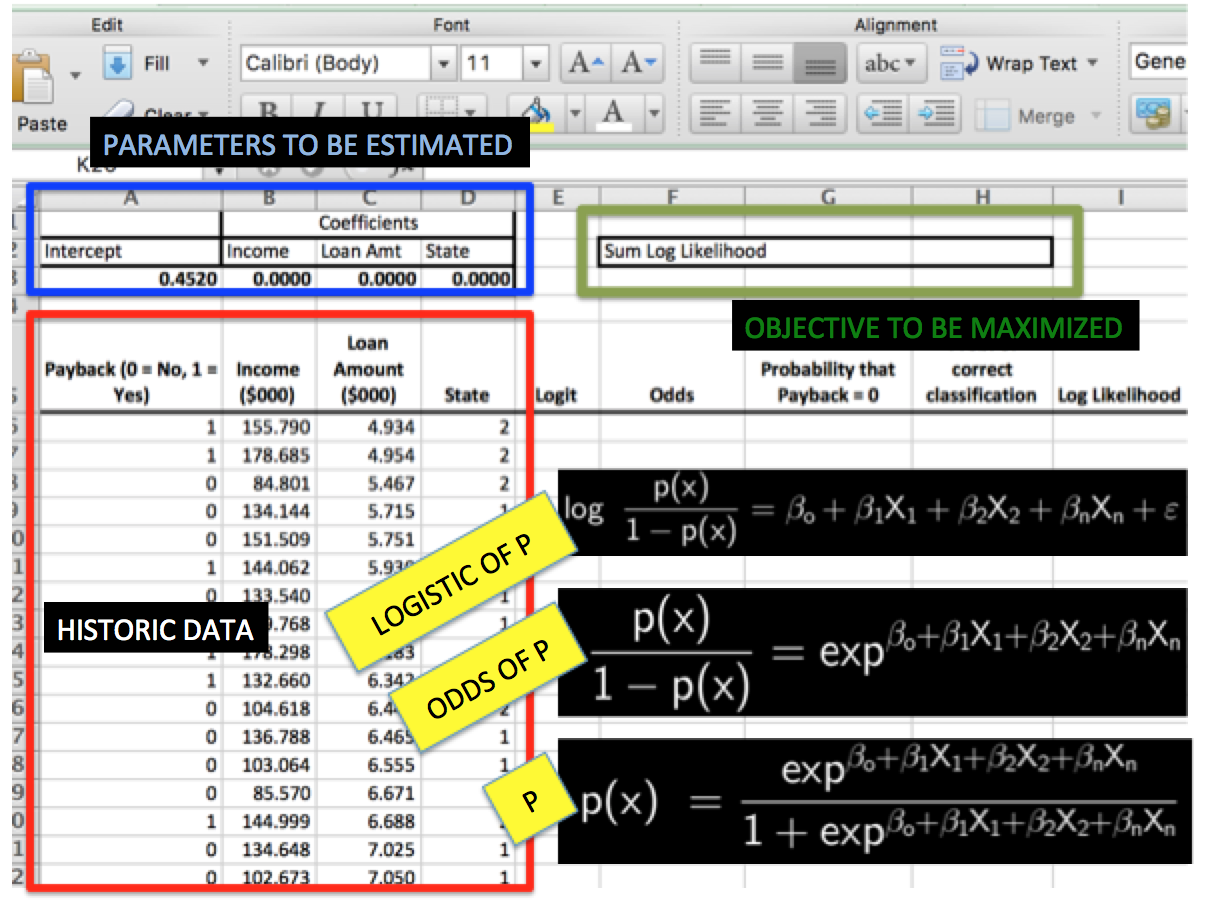
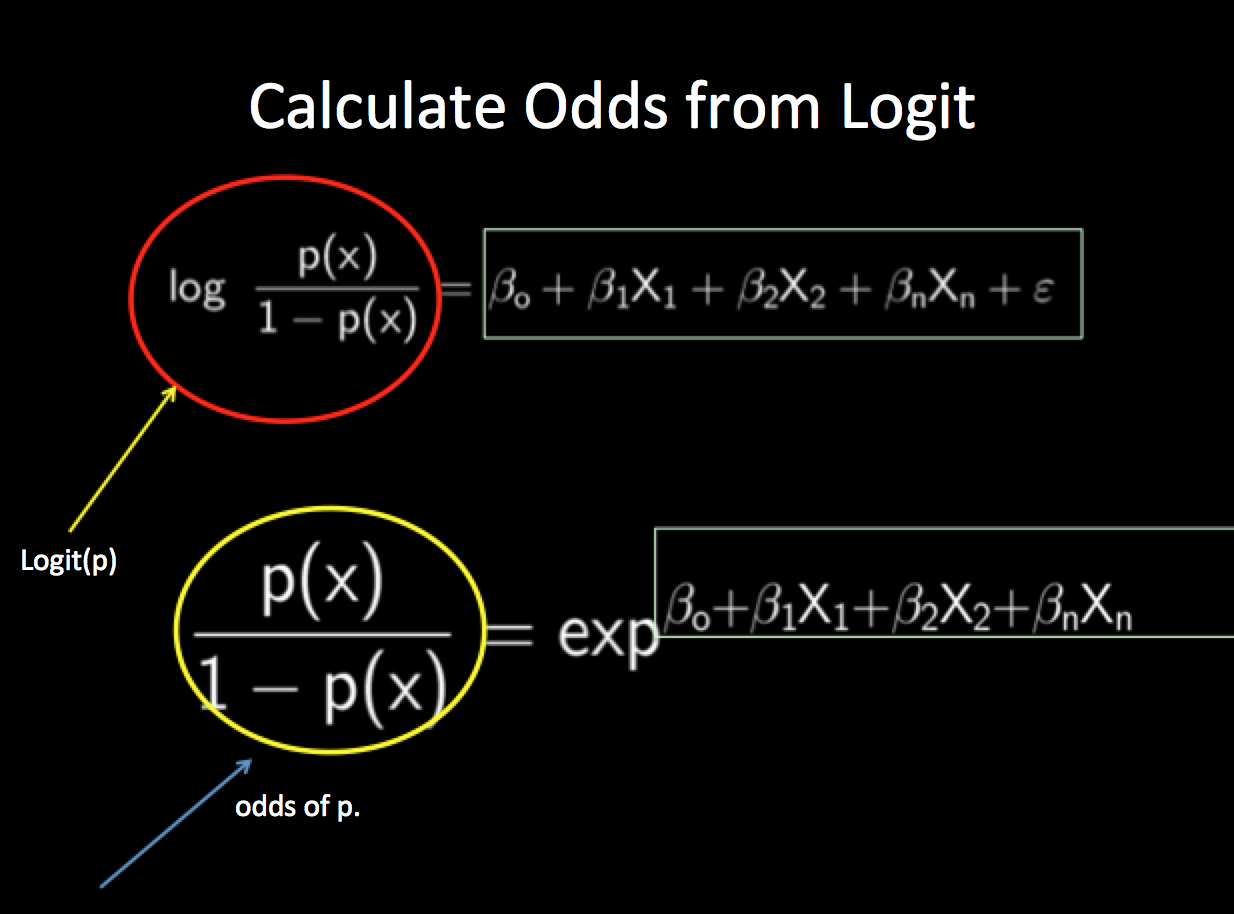
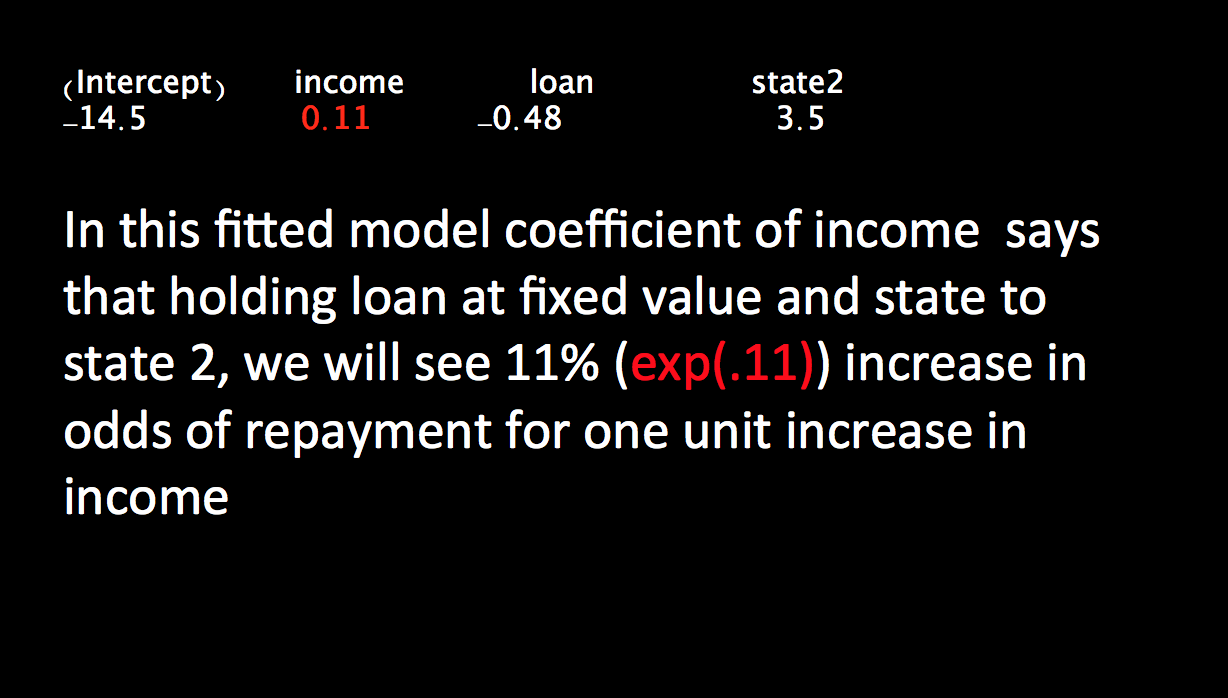
We use the log of the odds rather than the odds directly because an odds ratio cannot be a negative number—but its log can be negative.
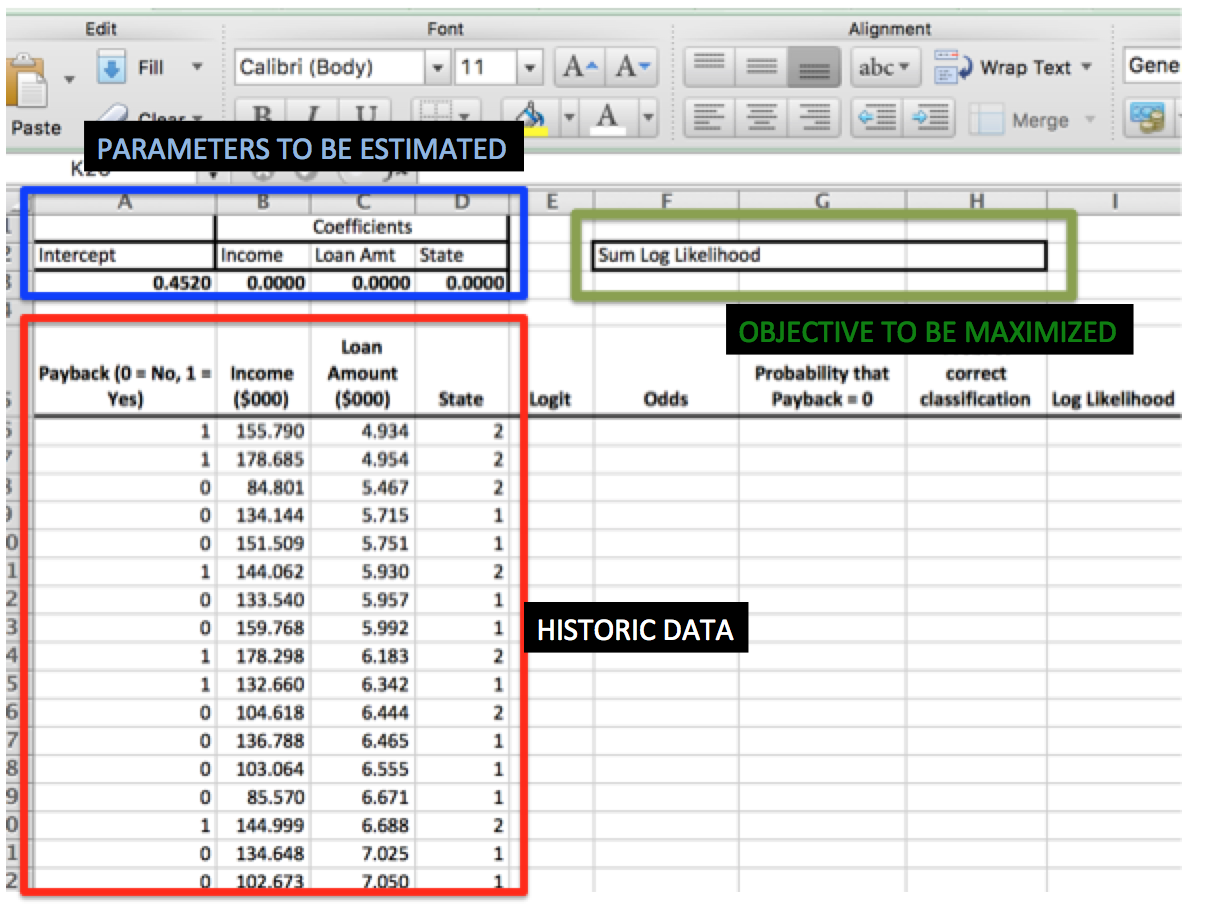
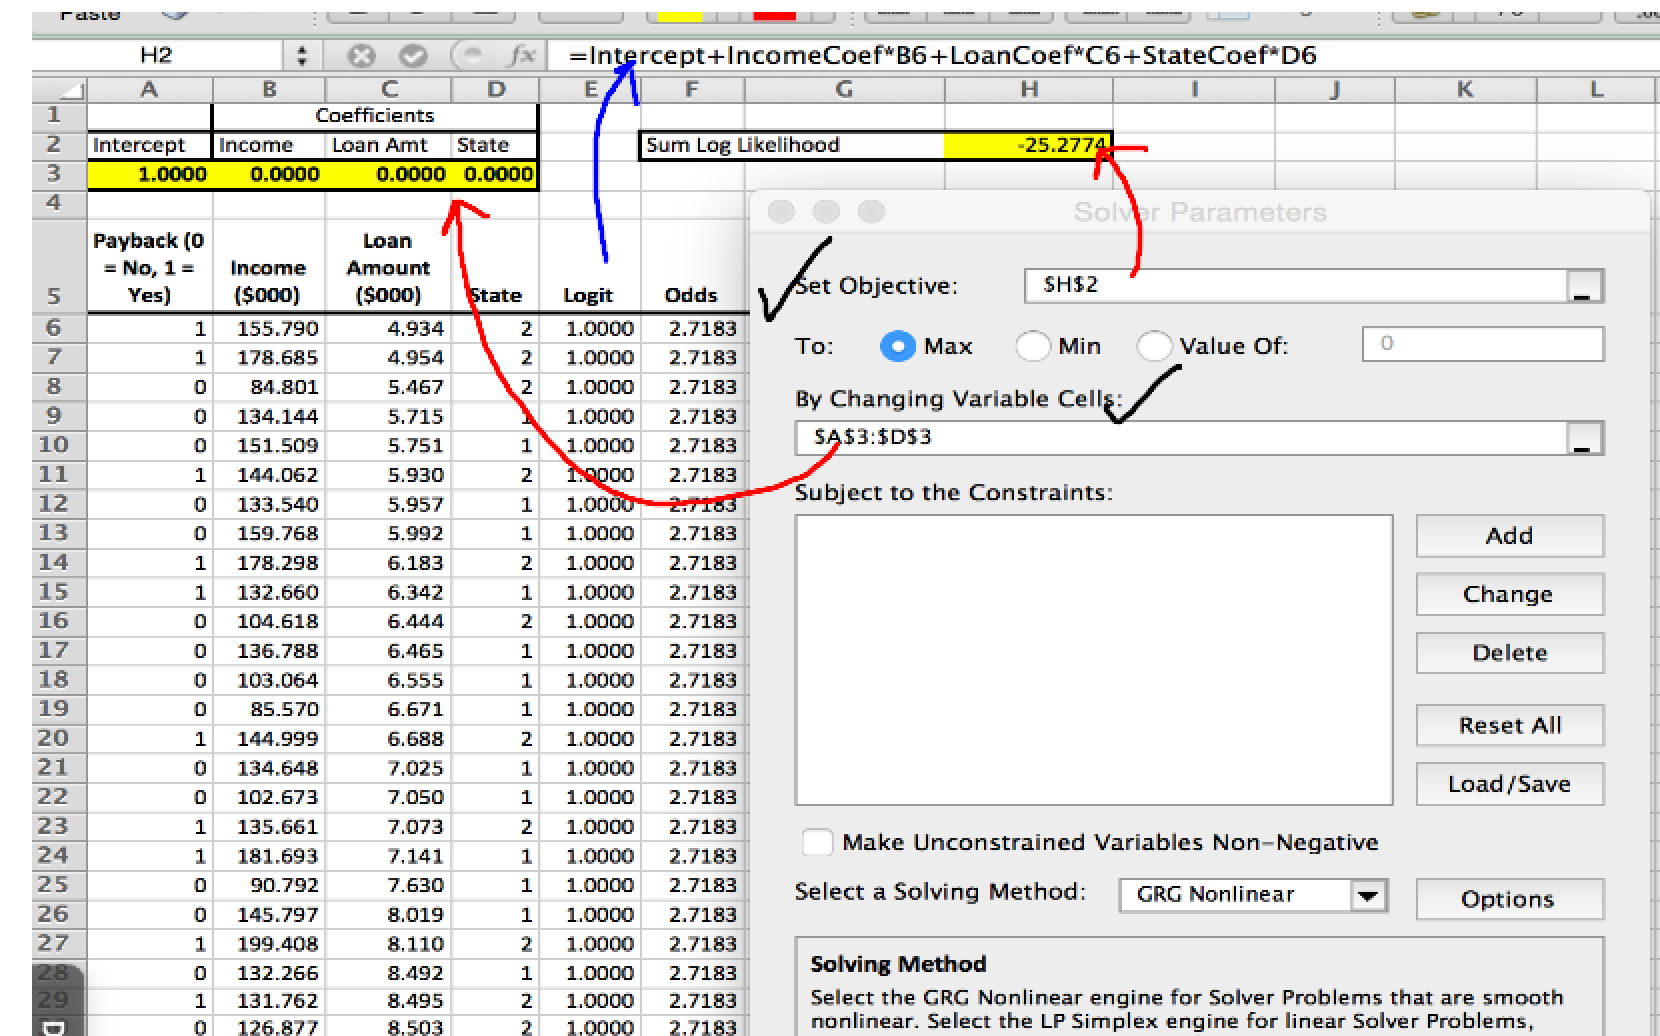
Notice that we have randomly initialized our coefficients for income and other predictors. These will be adjusted by Solver based on a likelihood function.We will cover them later
This video explains log-odds
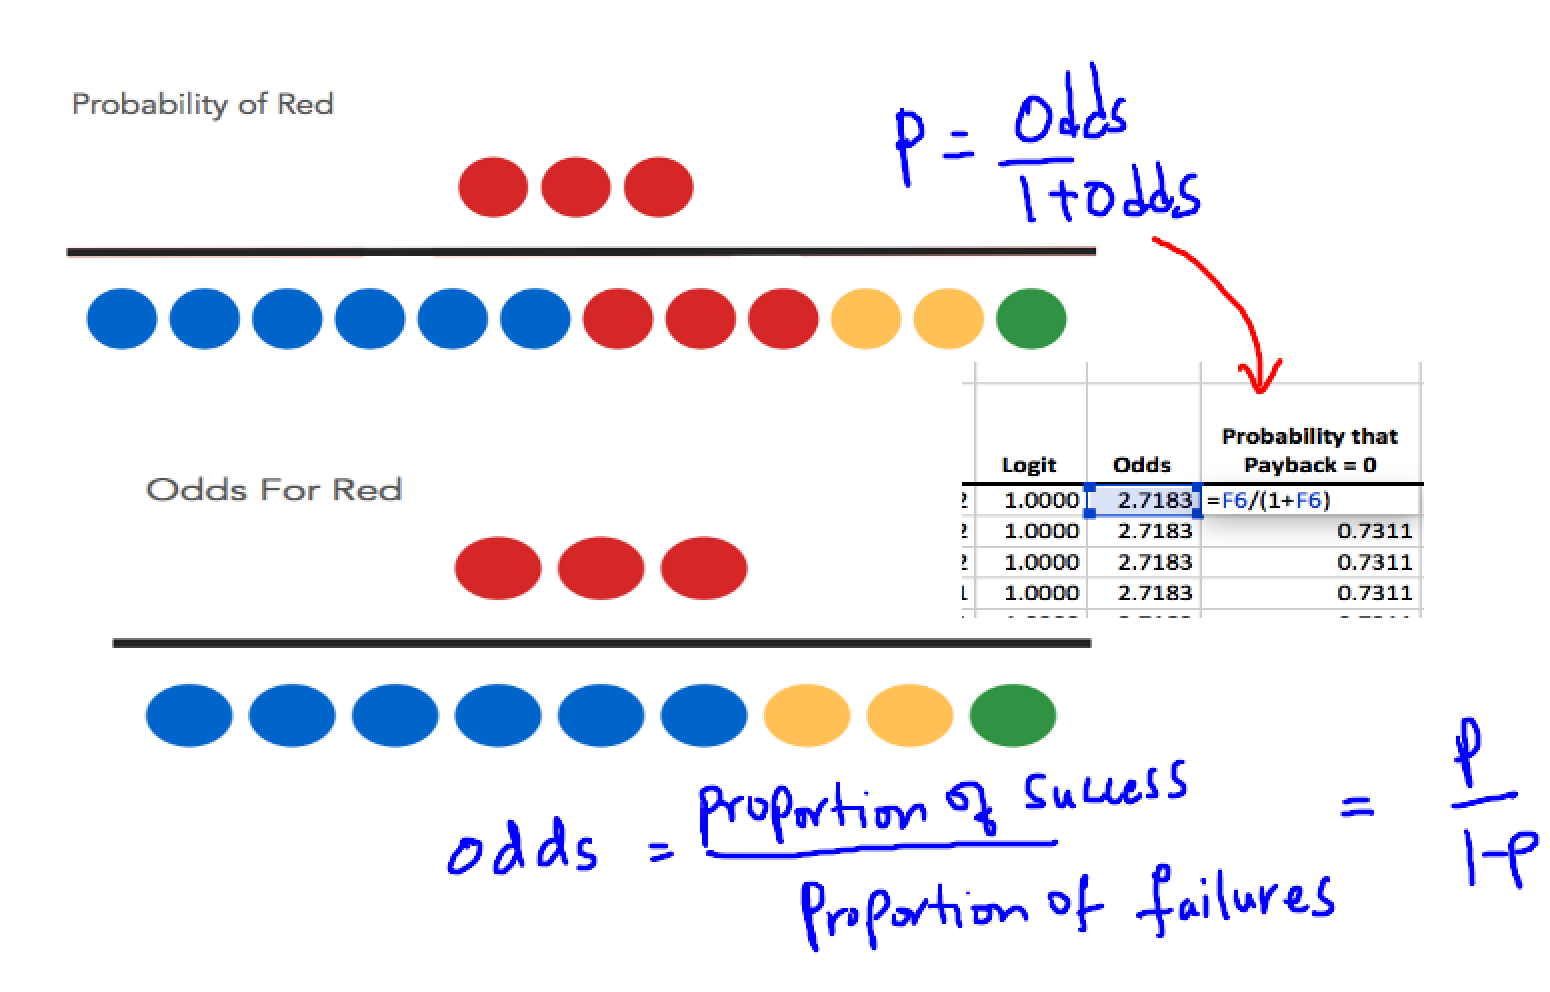
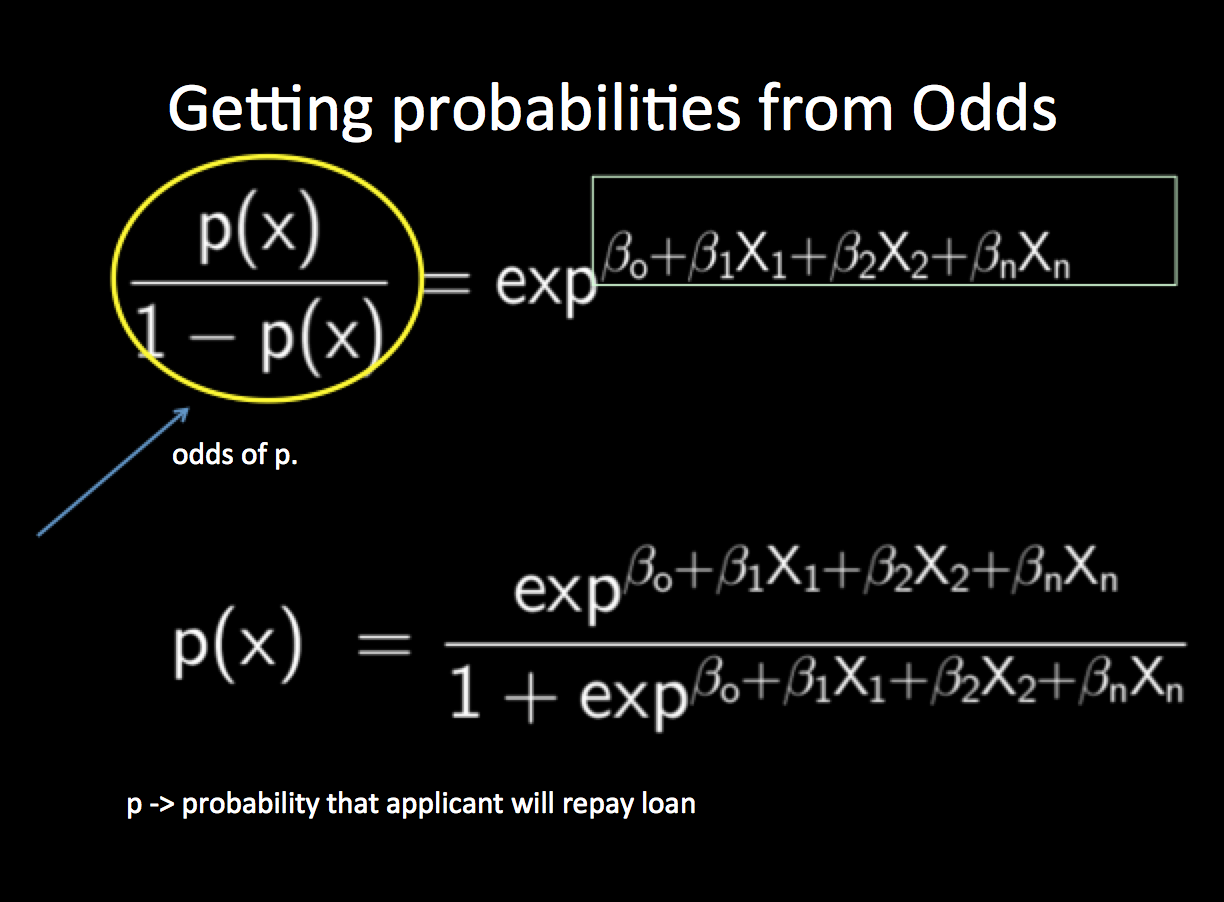
This column contains the calculated probabilities that each borrower will not repay a loan of a given Amount, given that the borrower has a given Income and other predictors
Column H tells us the predicted probability of the borrower’s actual behavior, whether that behavior is repayment or default—not simply, as in Column G, the predicted probability of defaulting on the loan. Outputs the probability of the datapoint’s belonging to a certain class
It is possible in theory to assess the overall accuracy of your logistic regression equation by getting the continued product of all the individual probabilities
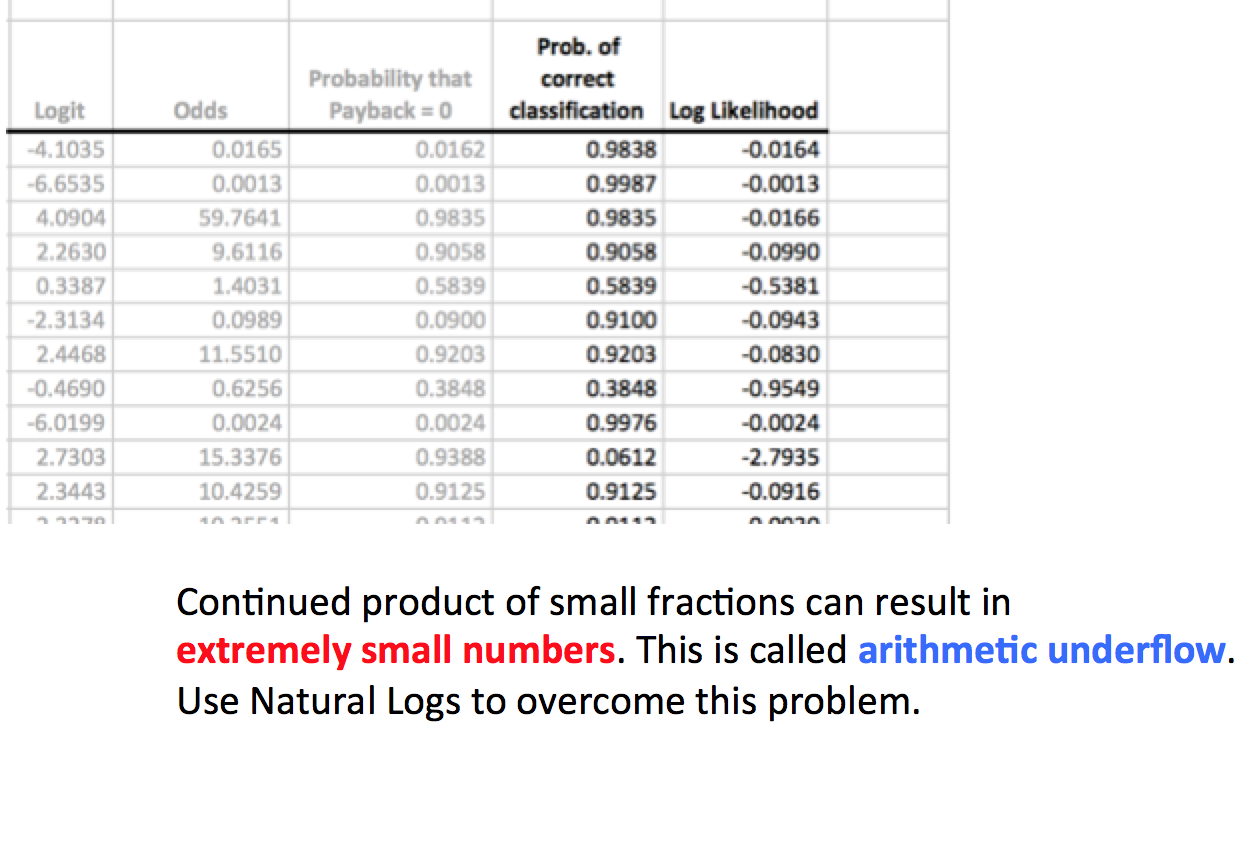
One property of logarithms is that their sum equals the logarithm of the product of the numbers on which they’re based
The logarithms of probabilities are always negative numbers, but the closer a probability is to 1.0, the closer its logarithm is to 0.0. Hence the Solver should be setup to adjust coefficients such that likelihood sum is maximum
Adjust the intercept and coefficients in such a way as to maximize the value in cell H2
I haven’t covered cross-validation, which is commonly used to validate a logistic regression equation.If you don’t always have a large number of cases to work with, a different approach is to use statistical inference. Will cover it in another blog post
Intuition behind concept of gradient vector: https://t.co/vejnoSADmr #DataScience #MachineLearning by @pavanmirla pic.twitter.com/DKcX1p9X4m
— Kirk Borne (@KirkDBorne) July 17, 2016
Build a Neural Net to solve the Exclusive-OR (XOR) problem: https://t.co/QmH0wzwOdA by @pavanmirla #DataScience #MachineLearning
— Kirk Borne (@KirkDBorne) September 16, 2016